#
Risk Module & WEB3: 📊 A Data-Driven Approach to Risk Analysis
#
Introduction 🚀
This document provides a technical demonstration of the Risk Module, designed to estimate the probability that an asset's price will remain within a specified range over a given timeframe.
The primary objective is assessing market volatility through statistical techniques grounded in the normal distribution model.
Furthermore, it outlines a broader conceptual vision — showing how traditional financial methodologies can gain new efficiencies within WEB3 environments, thanks to the unprecedented availability of open, transparent data.
#
Overview of the Risk Module 📈
The Risk Module evaluates the likelihood of an asset’s price remaining within a predetermined range (± threshold) after a set number of steps (minutes).
The core concept involves constructing a probability distribution of future prices based on current volatility measurements.
#
Key Technical Components
#
1. Normal Distribution Construction and Probability Calculation 🔔
Distribution Modeling:
The Risk Module builds a normal distribution reflecting price volatility.
The area under this curve within a target range directly translates into the probability of the price remaining within that range.
Example:
Calculating this area for ranges relevant to Uniswap CLMM pools produces precise probabilities essential for risk assessment.
#
2. Volatility Measurement (Delta) ⚖️
Calculation Method:
For consecutive asset prices ( P[t] ) and ( P[t+1] ), the relative change is computed as:
\delta_t = \left|\frac{P[t+1] - P[t]}{P[t]}\right|Noise Reduction:
A rolling average smooths short-term fluctuations, generating a more stable volatility measure.
#
3. Directional Movement Probabilities 🔄
The module also outputs directional probabilities (upward vs. downward movement).
Initially, probabilities are equal (50/50), but the model can adapt dynamically through:
Technical Analysis:
Deviations from moving averages and related metrics adjust parameters for greater prediction accuracy.Machine Learning & Clustering:
Historical data is categorized into clusters (e.g., volatility regimes), enabling adaptive predictions based on market state recognition.
#
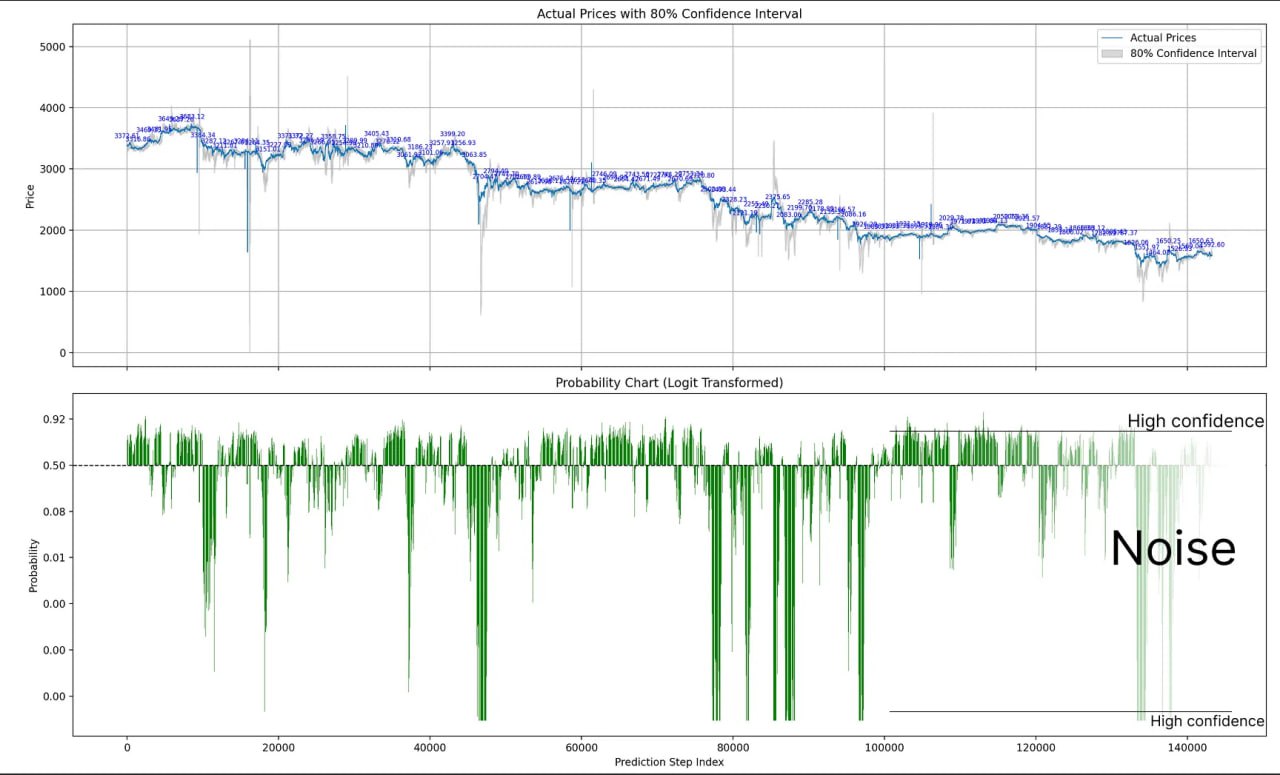
4. Focus on Extremes 🚩
The model emphasizes extreme probabilities — values far from the 40–60% range — which typically signify critical volatility shifts rather than noise.
#
Current Implementation 🛠️
An MVP version of the Risk Module is operational, capable of evaluating volatility predictions in both live-market and historical contexts.
It effectively captures significant volatility signals beyond ordinary market fluctuations.
#
The Vision: Leveraging Open Data for Enhanced Risk Analysis 🌐
Beyond its current implementation, this project envisions comprehensive, data-driven market modeling by integrating classical finance with WEB3 analytics.
The transparent, publicly accessible data from blockchains — wallet interactions, transactions, and liquidity flows — enables richer insights and smarter risk management.
#
1. Proven Reliability of Classical Methods
- Classical finance methods (e.g., normal distribution-based volatility models) have proven reliable for decades.
- Applying them to WEB3 preserves methodological rigor while leveraging greater data accessibility.
#
2. Enhancement through WEB3 Data Abundance
- WEB3’s transparency allows continuous refinement of statistical models and faster calibration.
- Detailed on-chain data (wallet activity, transaction patterns, liquidity movements) supports advanced segmentation and clustering.
#
3. Identification of Critical Market Signals
- Detecting major deviations in vast datasets enables early detection of volatility events.
- Focusing on extremes allows for proactive risk management rather than reactive response.
#
Future Directions 🚀
- Integration of Machine Learning Models — Neural networks and clustering for market state classification.
- Real-Time Data Calibration — Live WEB3 data feeds for continuous model adaptation.
- Advanced Volatility Prediction — Novel metrics to improve the accuracy of future volatility forecasts.